
"My traffic looks good, but why aren't more people buying?"
Because most analytics show you where people go — Cignify shows you what they actually wanted.
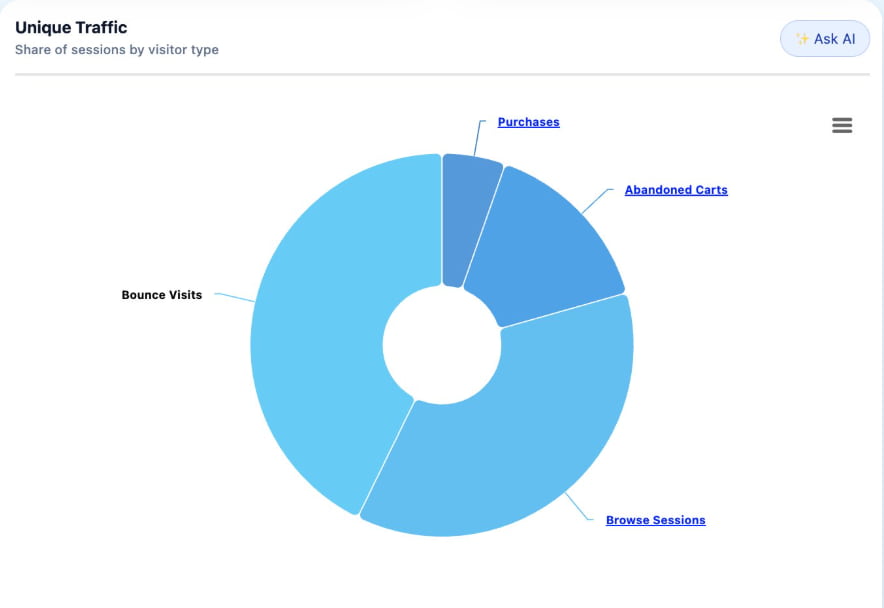
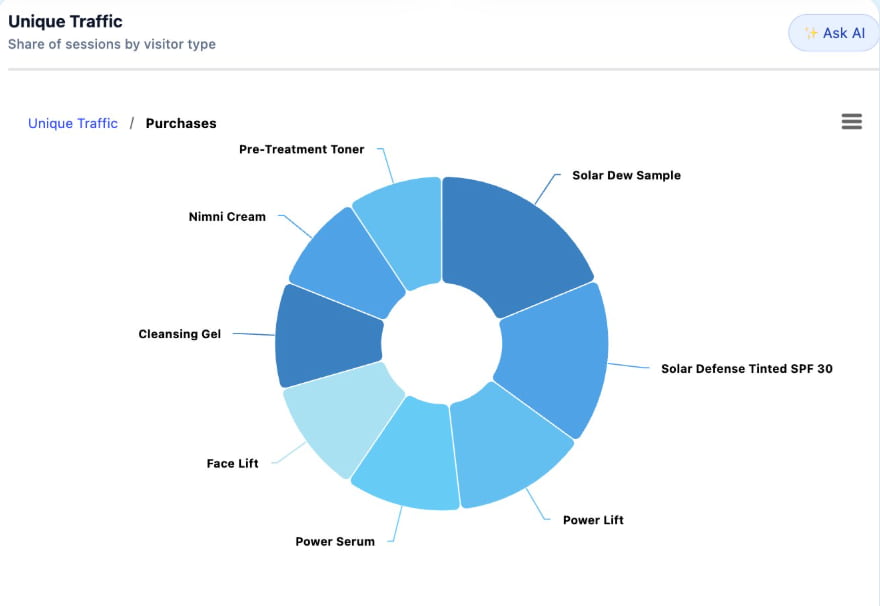
See that visitor who browsed your Power Serum but abandoned their cart? They're not a lost cause — they're a warm lead with a specific product interest. Here's what you can do:
🔍 See Customer's Product Level Intent in Action
Click through any segment to understand exactly what products your customers interacted with
Immediate Actions You Can Take:
✦ The Cignify Difference
Traditional analytics show you page views and sessions. Cignify shows you product-level intent — which specific items your customers were considering at each stage of their journey. You don't just know they visited your site; you know they were interested in Power Serum but needed one more push. That's not analytics — that's revenue intelligence.
"I'm spending on paid ads, but I have no idea which channels are actually making money."
Because your current attribution model is probably giving 100% credit to the last click — Cignify maps every touchpoint and shows you the true ROI of every channel.
You're spending on Google, Meta, email, and influencers simultaneously. Without multi-touch attribution, you're flying blind on which combinations actually drive revenue.
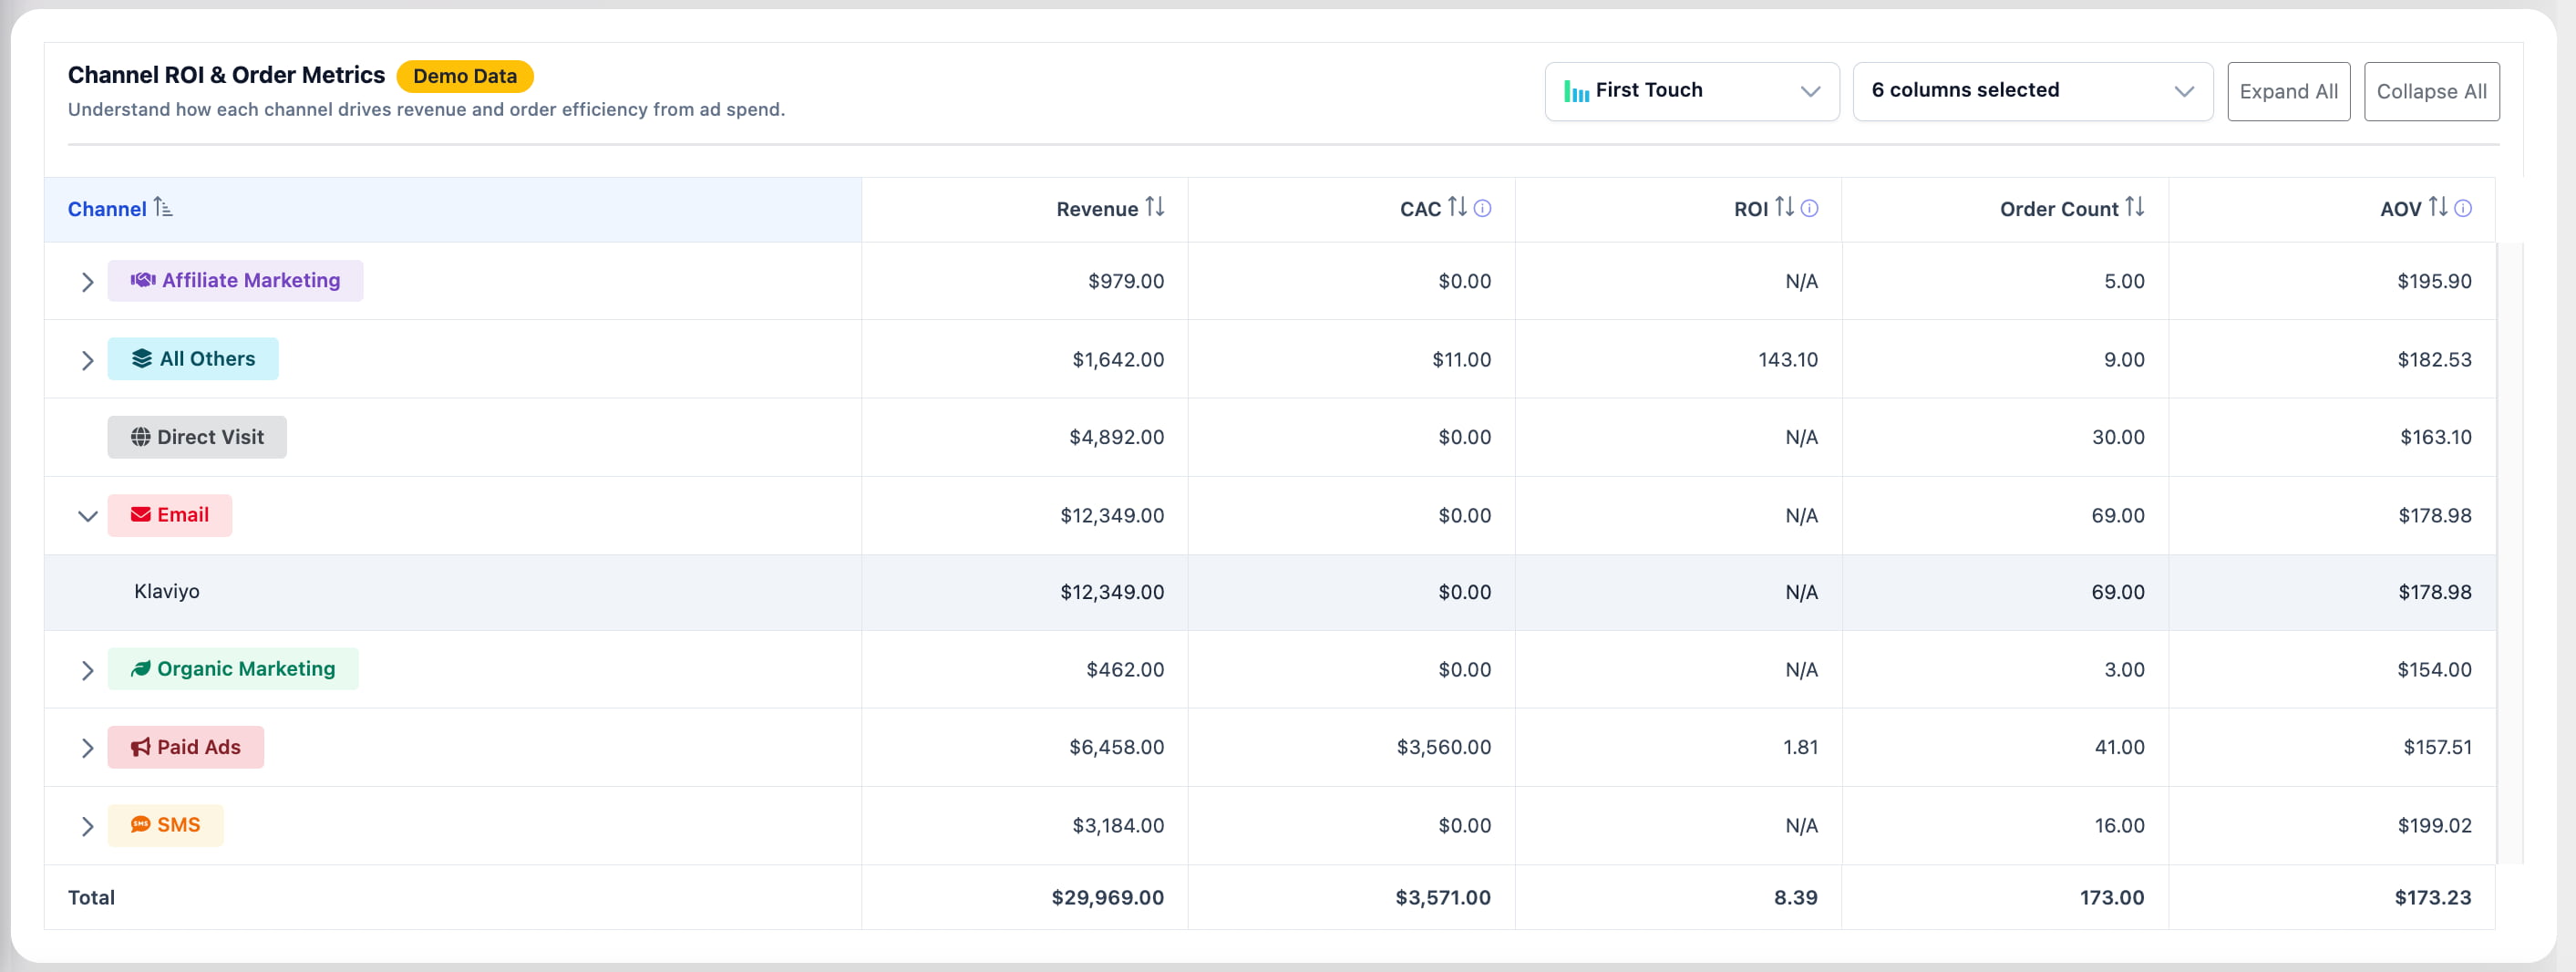
📊 Channel Performance at a Glance
See exactly which channels are driving revenue, burning budget, or hiding untapped potential
Immediate Actions You Can Take:
✦ The Cignify Difference
Traditional dashboards show cost-per-click and ROAS in isolation. Cignify connects every touchpoint to actual downstream revenue and LTV — so you're not optimizing for cheap clicks, you're optimizing for valuable customers. That's not spend tracking — that's spend intelligence.
"Carts are getting abandoned. How do I recover that revenue without wasting ad spend?"
Because most cart recovery is one-size-fits-all. Cignify identifies which abandoners are actually worth recovering — and activates precision retargeting only where it will convert.
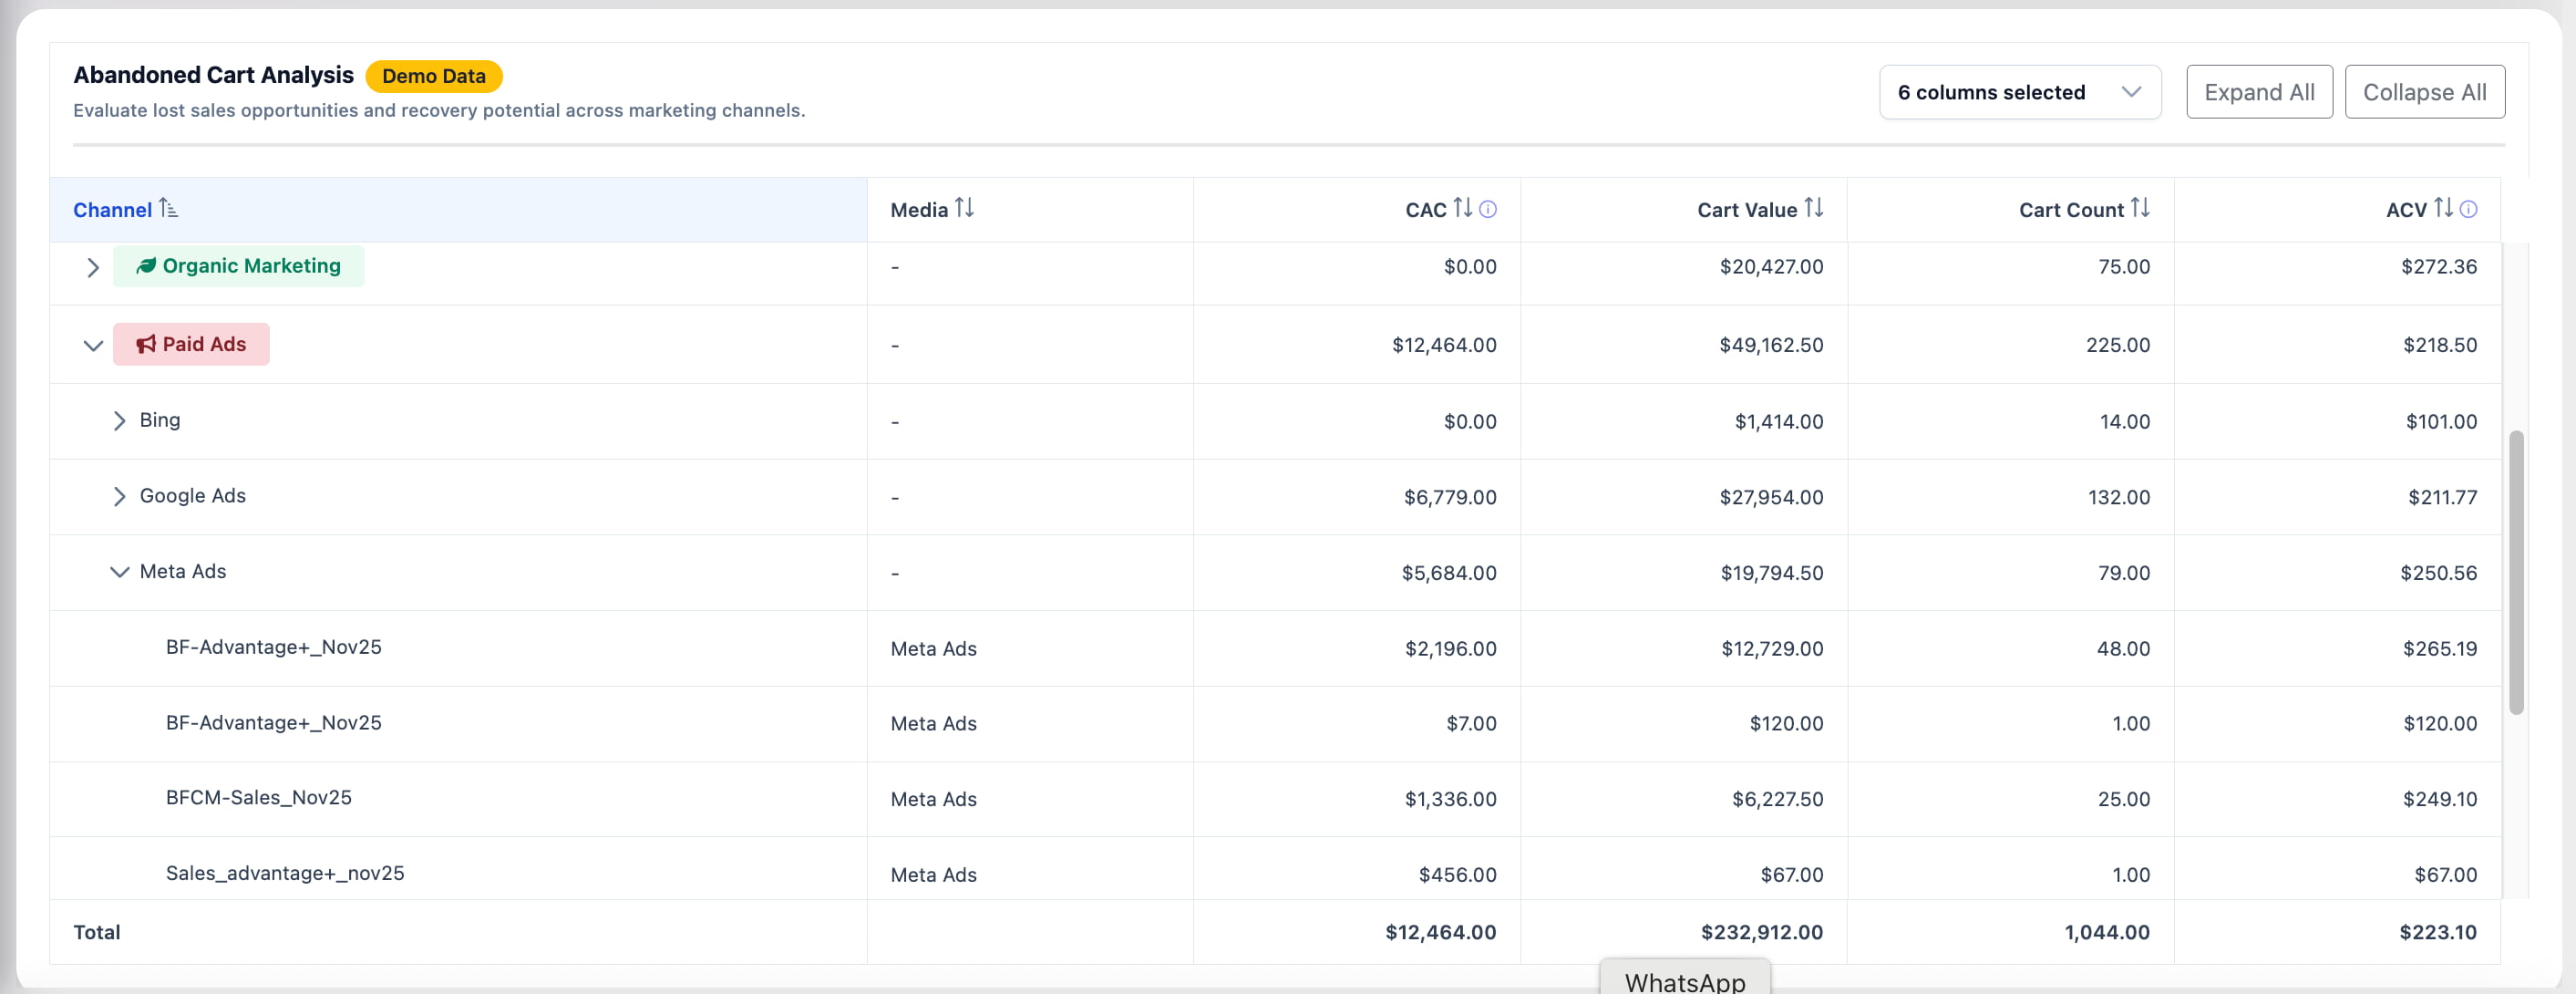
🛒 Cart Abandonment Breakdown
See exactly which products are left behind, which channels drive abandonment, and the true revenue opportunity sitting in those carts
Immediate Actions You Can Take:
✦ The Cignify Difference
Traditional dashboards show "cart abandonment rate" as a single number. Cignify shows you abandoned cart value by product, by channel, and by campaign — then activates precision retargeting using real-time behavioral signals to identify high-intent shoppers. This isn't just cart recovery — it's intelligent revenue rescue with measurable ROI.
"Which marketing touchpoints actually drive conversions — and which customers are worth the most over time?"
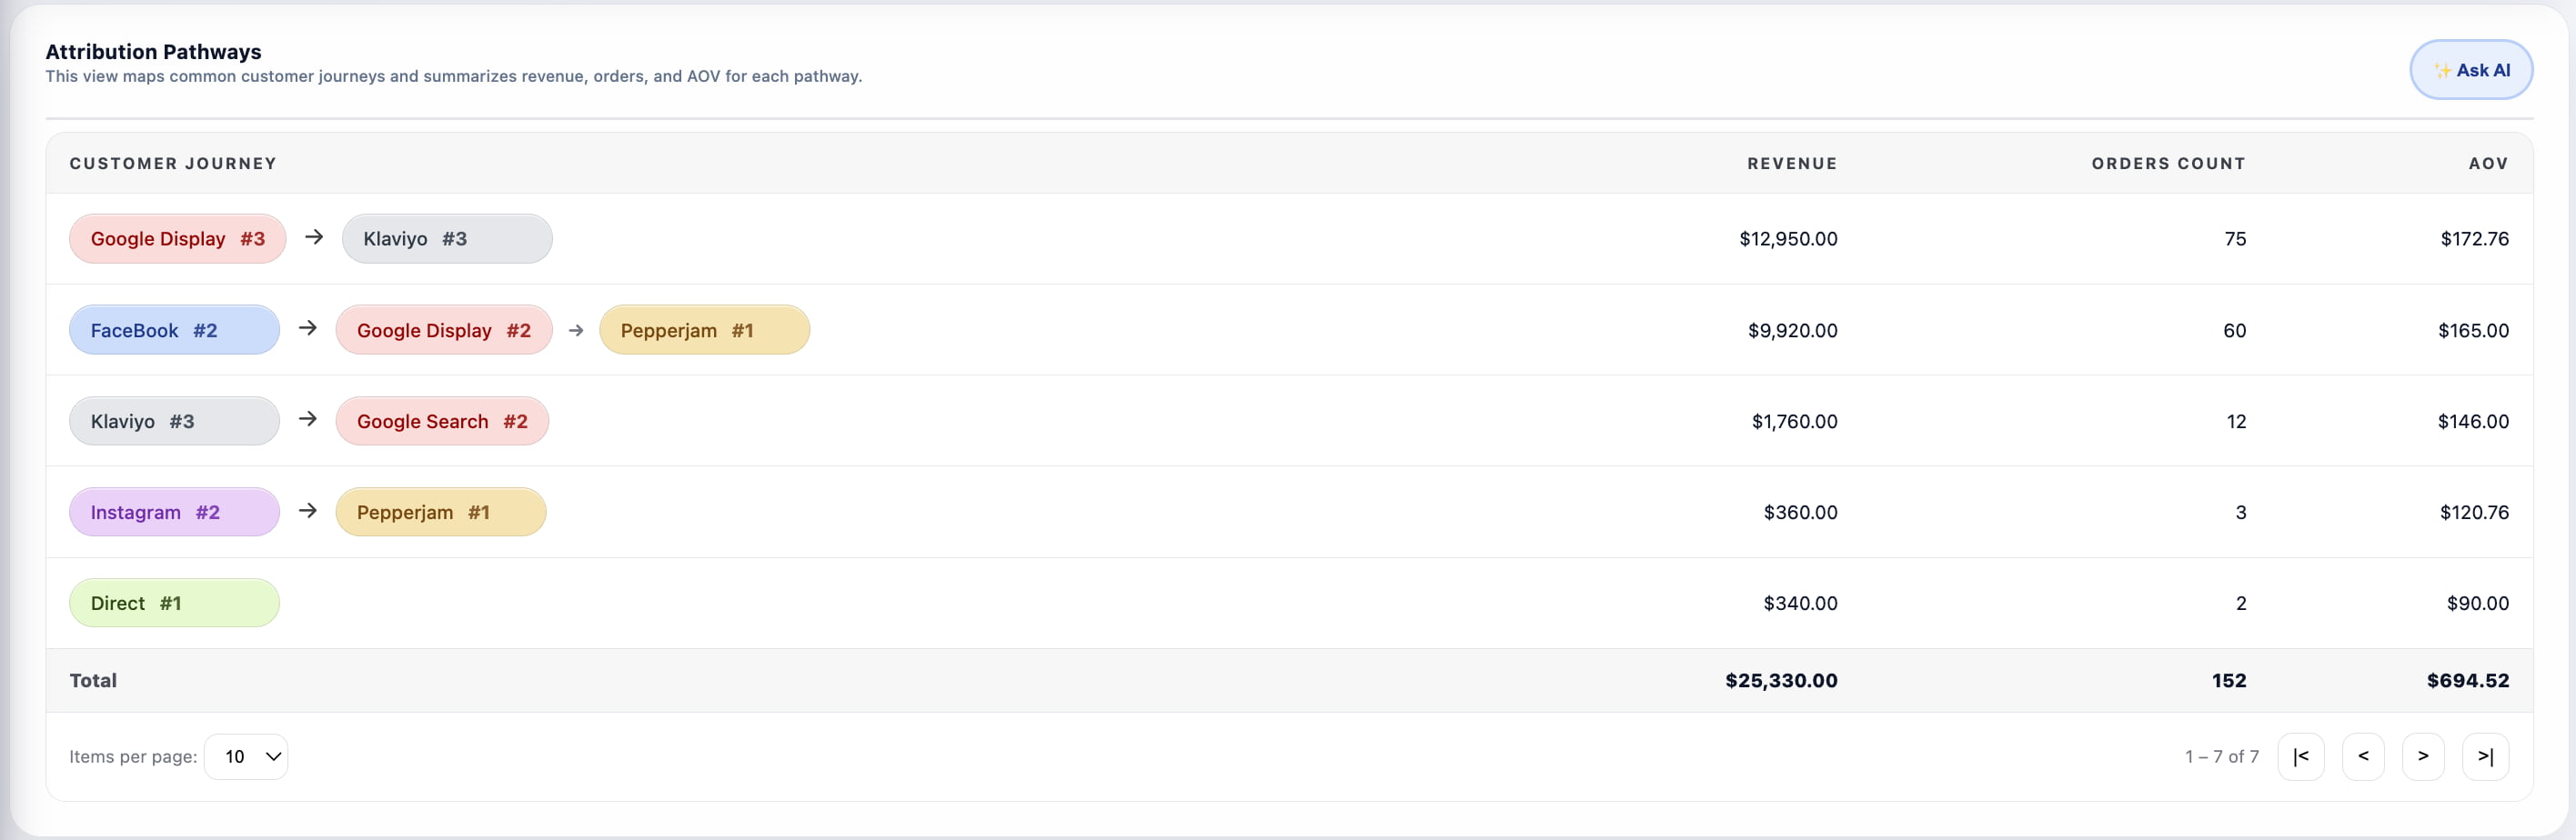
Most businesses give 100% credit to the last click and treat all customers equally. But Cignify maps the entire customer journey across every touchpoint AND ranks customers by downstream LTV — showing you which channel combinations create your most valuable repeat customers.
🗺️ Attribution Pathways & Customer LTV Mapping
Map common customer journeys, see revenue and AOV for each pathway, and identify which touchpoint combinations drive your highest-LTV repeat customers.
Immediate Actions You Can Take:
✦ The Cignify Difference
Traditional attribution is a lie you tell yourself about the last click. Cignify maps every touchpoint in the true customer journey — then overlays downstream LTV so you're not just measuring who bought, but who became a loyal customer. That's not attribution — that's lifetime value navigation.
"How do I know which products deserve more investment and which are quietly draining my margins?"
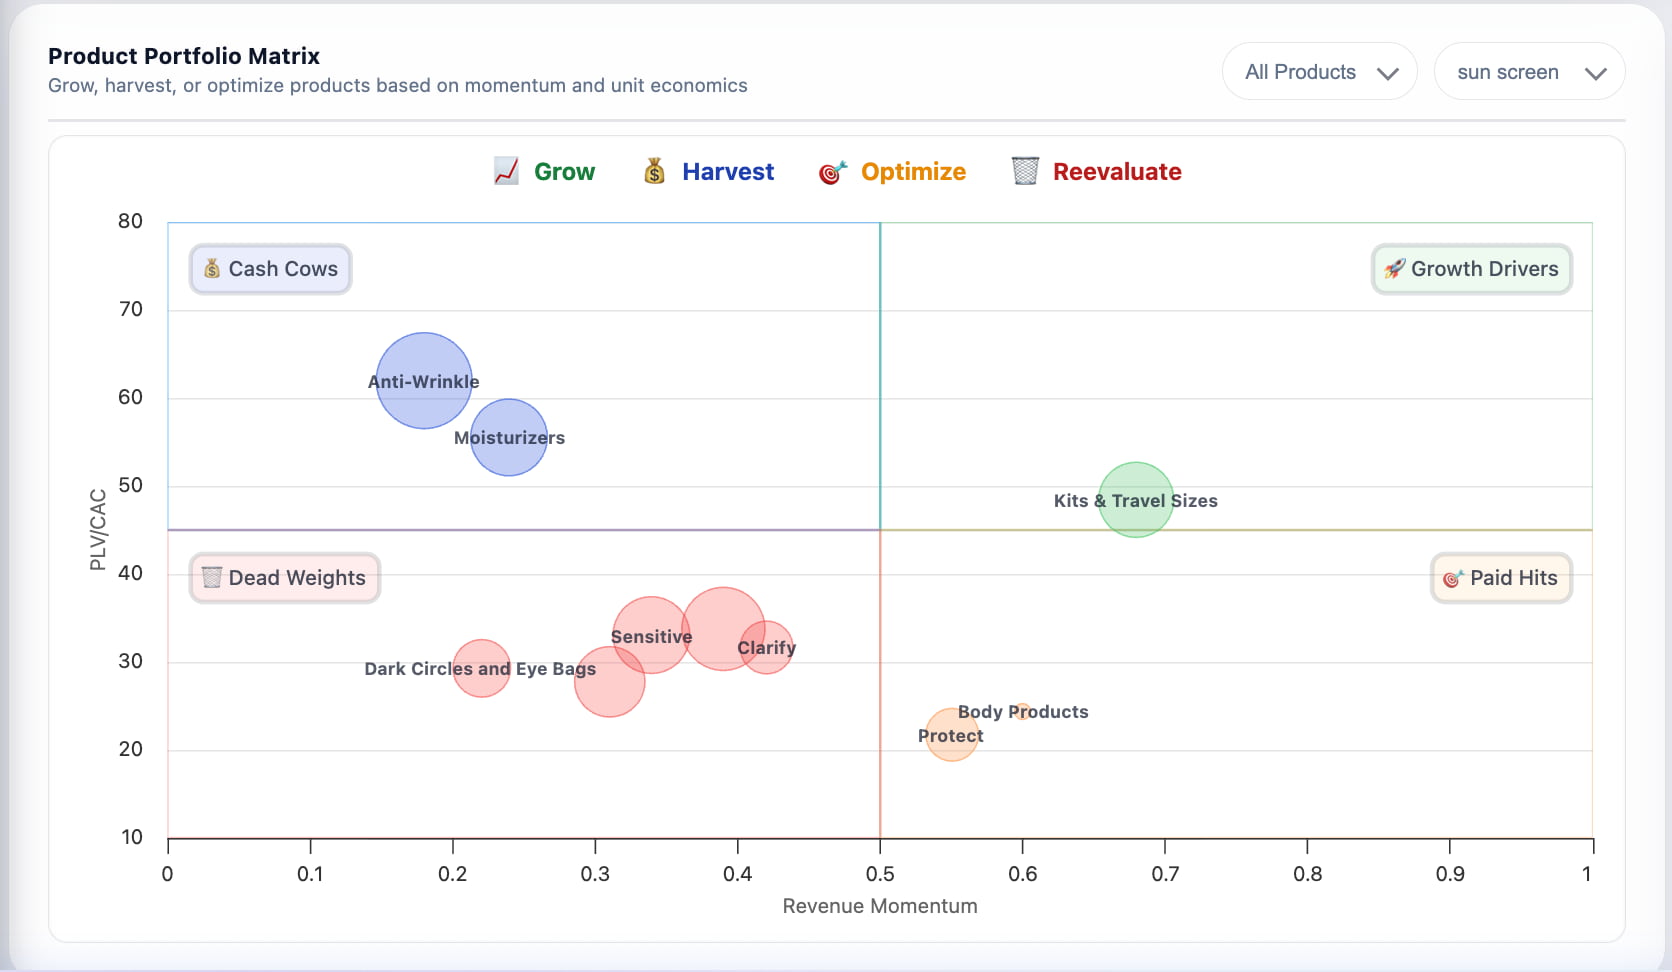
Because most analytics show a flat revenue list. Cignify maps every product on a 2x2 matrix of revenue momentum vs. unit economics — automatically categorizing them into Grow, Harvest, Optimize, or Reevaluate.
📊 Product Performance Matrix
Map every product on momentum vs. economics — instantly see where to invest, harvest, optimize, or cut.
Immediate Actions You Can Take:
✦ The Cignify Difference
Traditional analytics show revenue by product in a flat list. Cignify maps every product on a 2x2 matrix of revenue momentum vs. unit economics — automatically categorizing them so you always know where to invest, protect, and cut. This isn't revenue reporting — it's strategic product portfolio management powered by real-time data.
Which products are your real revenue engines — and where should you focus your firepower?
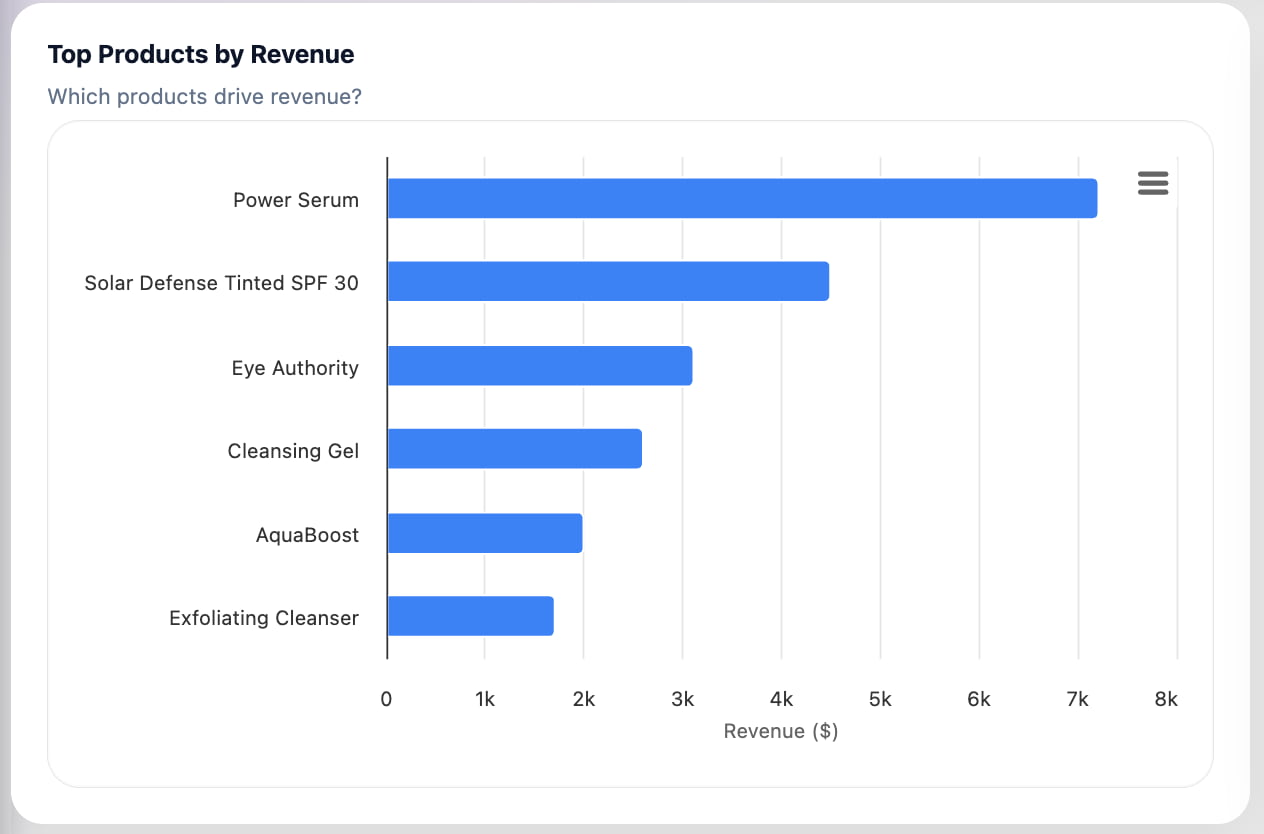
Most businesses track "best sellers" by units sold. But Cignify ranks products by actual revenue generated — showing you which items are your true revenue drivers, not just your most frequently purchased products.
🏆 Top Revenue-Driving Products
See where your revenue is actually coming from — and are you doubling down on winners?
Immediate Actions You Can Take:
✦ The Cignify Difference
Traditional analytics show "best sellers" by units sold or SKU count. Cignify ranks products by actual revenue generated — showing you which items are your true business drivers, not just your most frequently clicked. You see the exact revenue gap between your #1 and #2 performers, understand which products deserve the lion's share of marketing budget, and identify where mid-tier products are plateauing. This isn't a vanity popularity contest — it's a revenue-driven product strategy dashboard that shows you where to invest, protect, and grow.
🌌 Your Revenue Constellation is Complete.
Congratulations. You've navigated the full picture — from scattered data points to a complete, illuminated revenue map.
Just as Cignify holds your entire revenue data above — every signal, every constellation, every navigation route — Cignify holds your entire revenue universe in view. Every customer signal. Every channel. Every product. Every opportunity.
✦ Ready to Map Your Revenue Universe?
Start connecting attribution, product performance, and customer LTV today. Every constellation in your revenue map will work together seamlessly — guiding you to predictable, accelerated growth.